Description
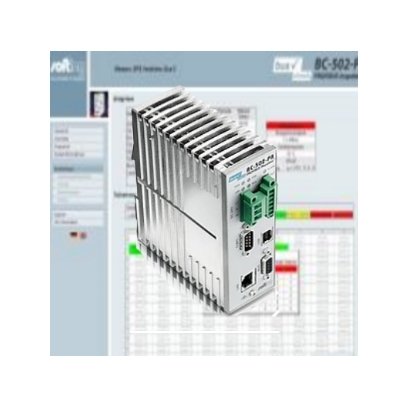
The PROFIBUS Monitor is an “inspector” for the continuous monitoring of the data communication on PROFIBUS DP. In case the tool detects critical changes that could result in a future network failure it automatically generates a notification that maintenance action is required.
Early detection of bus problems
The PROFIBUS Monitor is designed for fixed installation in control cabinets. One PROFIBUS Monitor per bus line is all that is needed – no matter how many physical segments are to be monitored. In addition, the tool’s open functionality allows use across all controller and PROFIBUS device types. The PROFIBUS Monitor reliably detects deteriorations in the bus communication and reports them to the operational staff. This allows implementing a condition-based maintenance strategy that reduces operator intervention to when it is needed. In this way, routine system downtimes can be used for planned maintenance action, making best use of the often scarce maintenance resources.
Easy use and clear readings
| No bus address or program changes to the PLC program are needed when installing the PROFIBUS Monitor. Configuration and visualization are performed over the network via an easy-to-use, integrated web interface. Setup, commissioning, and problem analysis require a basic knowledge of PROFIBUS. |  |
Advance warning of impending failure
On connection to a PROFIBUS segment, the PRPFIBUS Monitor automatically detects the baud rate and immediately starts monitoring. It determines the bus cycle times and counts critical events. Critical events on the PROFIBUS are error frames, retries, restarts, and diagnostic messages. In this way, the typical slow deteriorations on “aging” installations and connected devices can be reliably detected. When the number of error events exceeds the specified maximum limit per time unit, the PROFIBUS Monitor sends an alarm to the PLC via a signaling contact, or optionally to a server over the Ethernet network.
The last 100 errors are stored in an alarm list. In the case of an alarm, the tool offers the possibility to create a frame traffic trace for the period of interest. The trace file can then be analyzed later using the PROFIBUS Diagnostics Suite PC software.


